Reports
Reports of the conversations which has happened over time, can be viewed in the Reports Section. Click on Reports on home page.
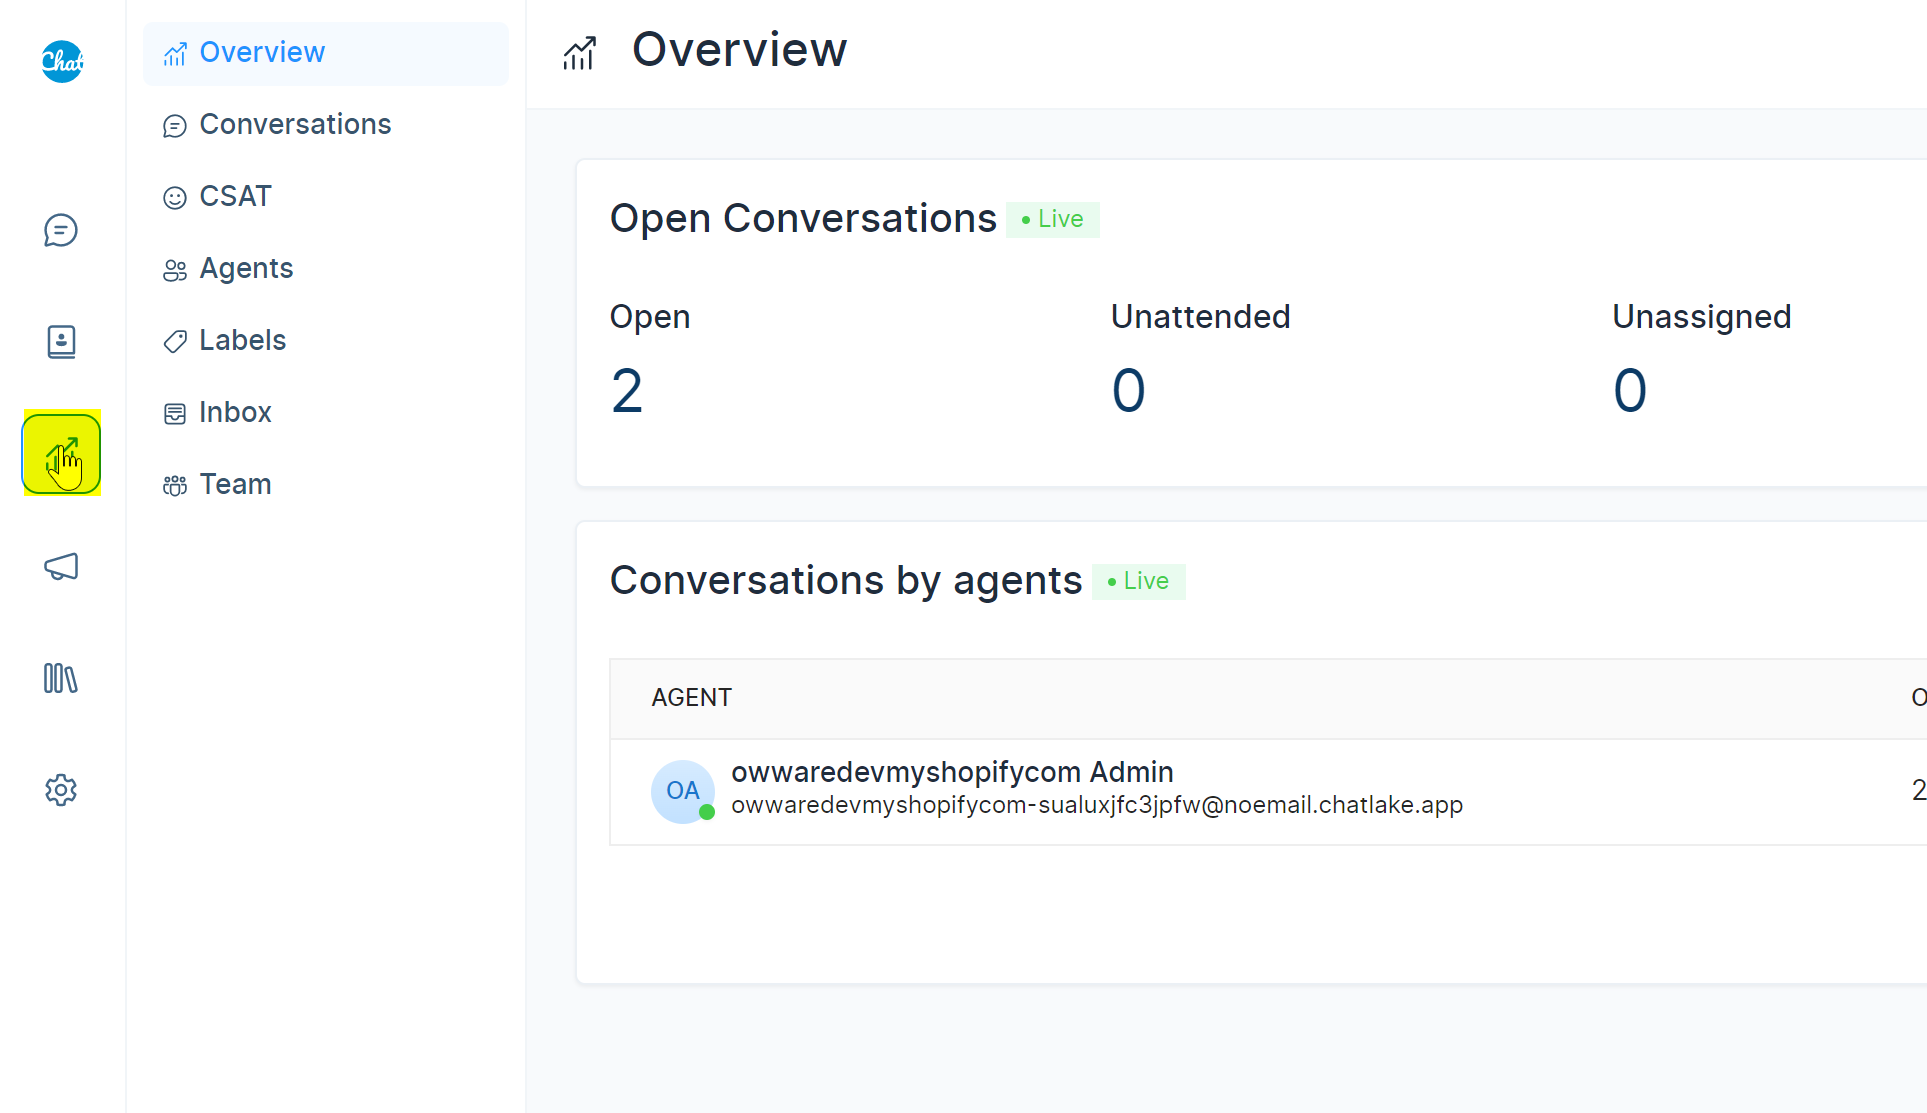
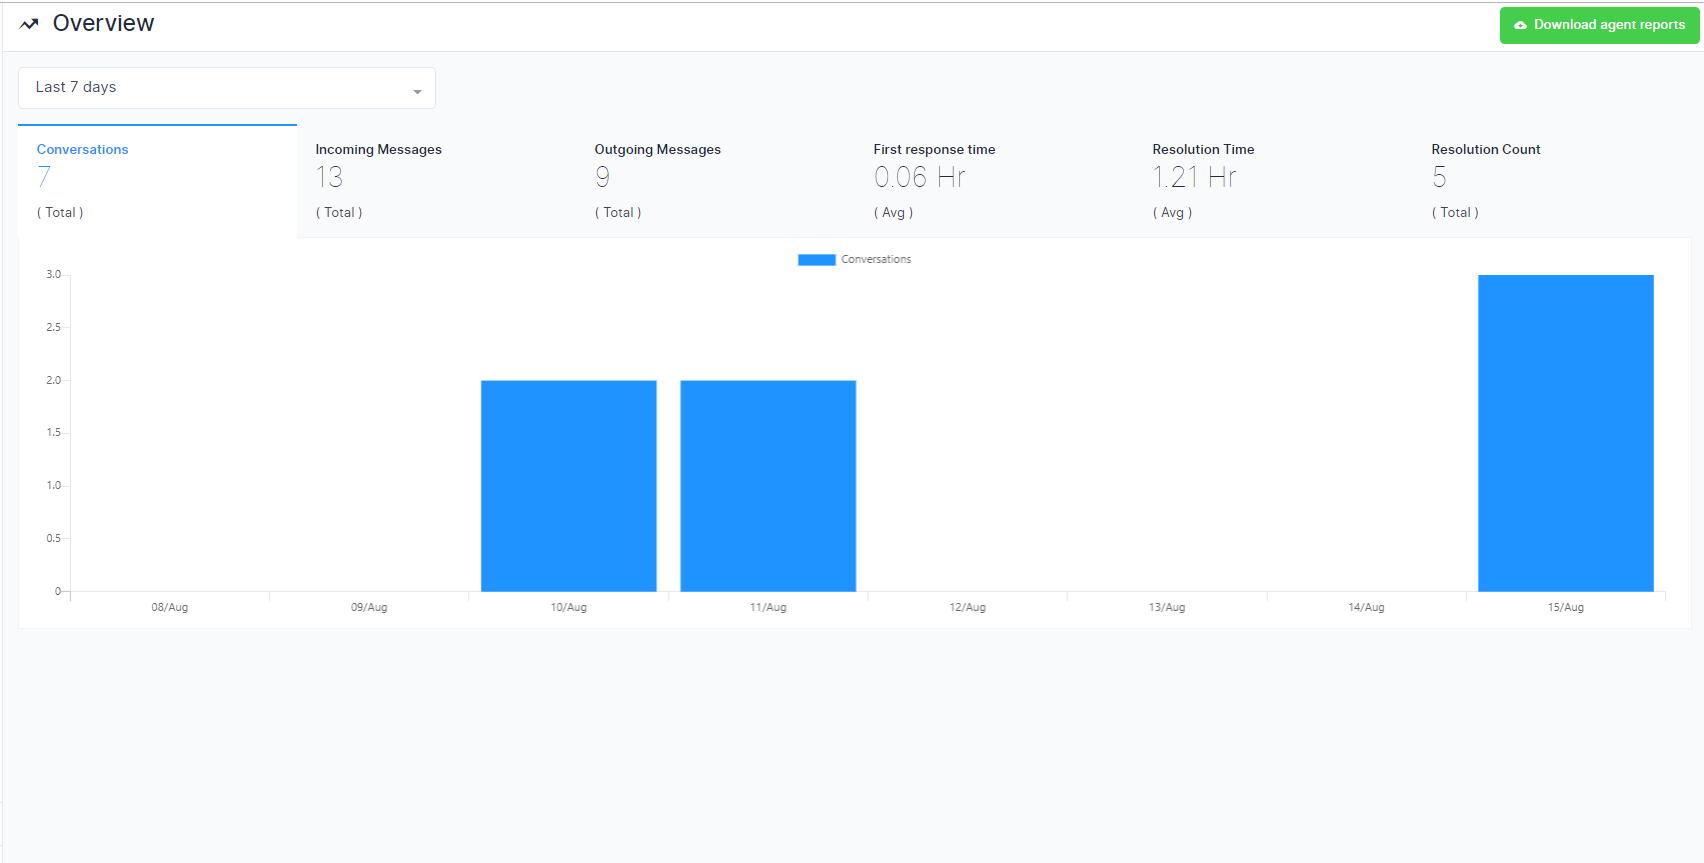
The below window opens up with Overview of the Reports.
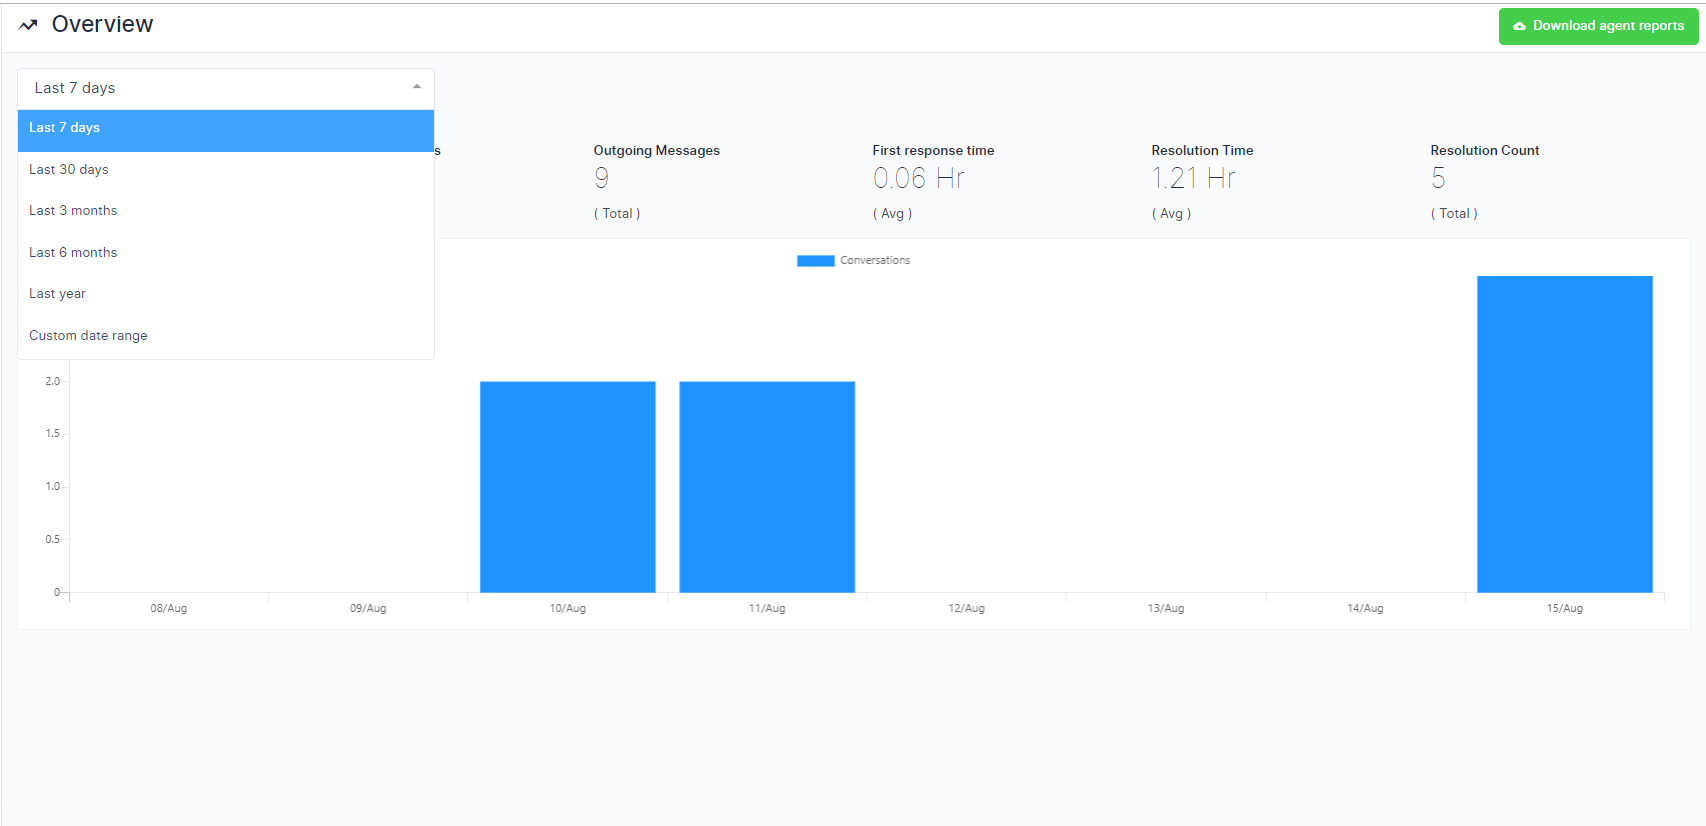
Report can be generated for various durations. This can be done by selecting the time period in the drop-down list as shown below. By default, it is for last 7 days.
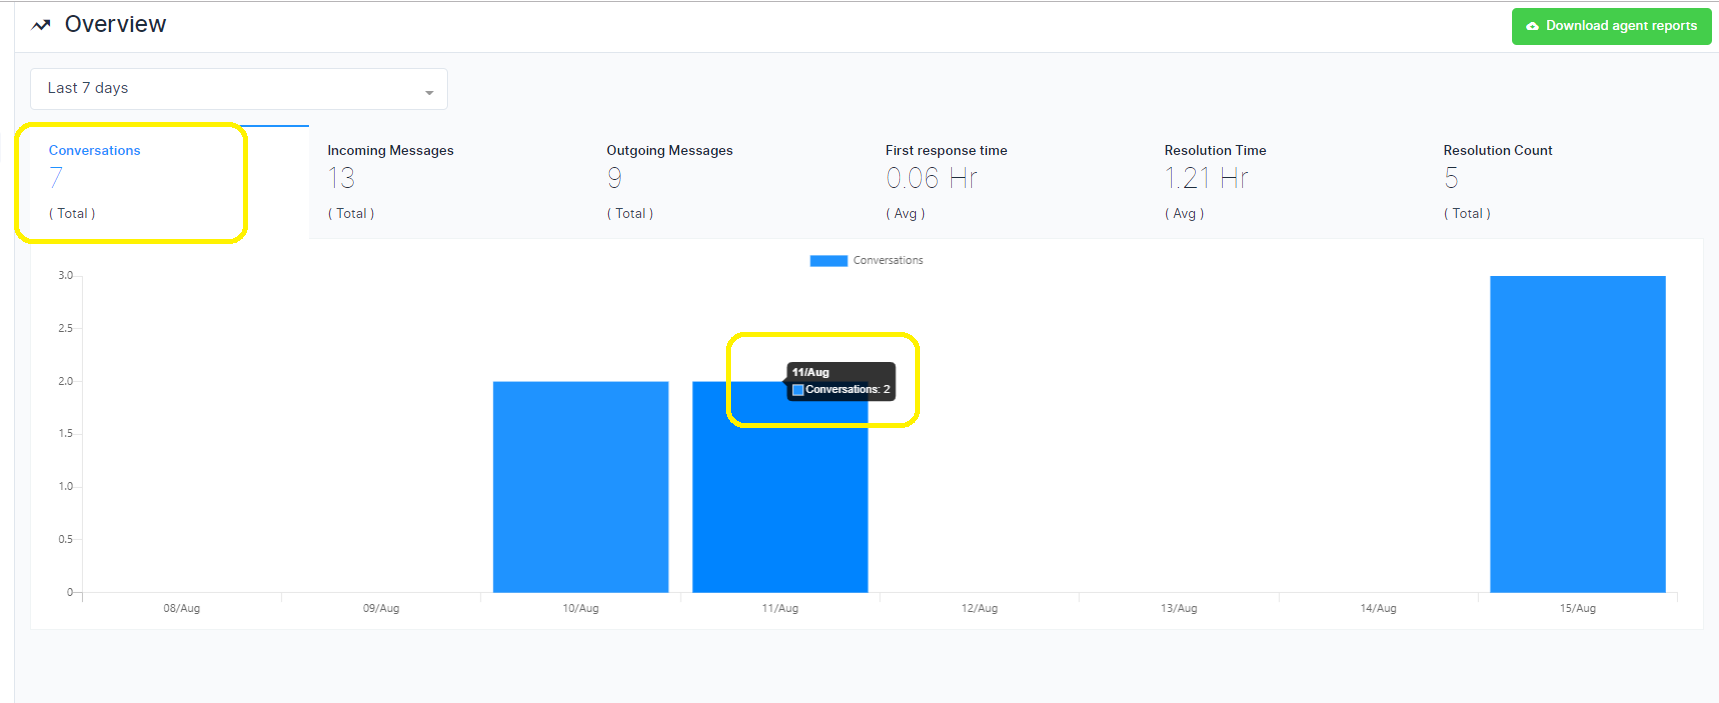
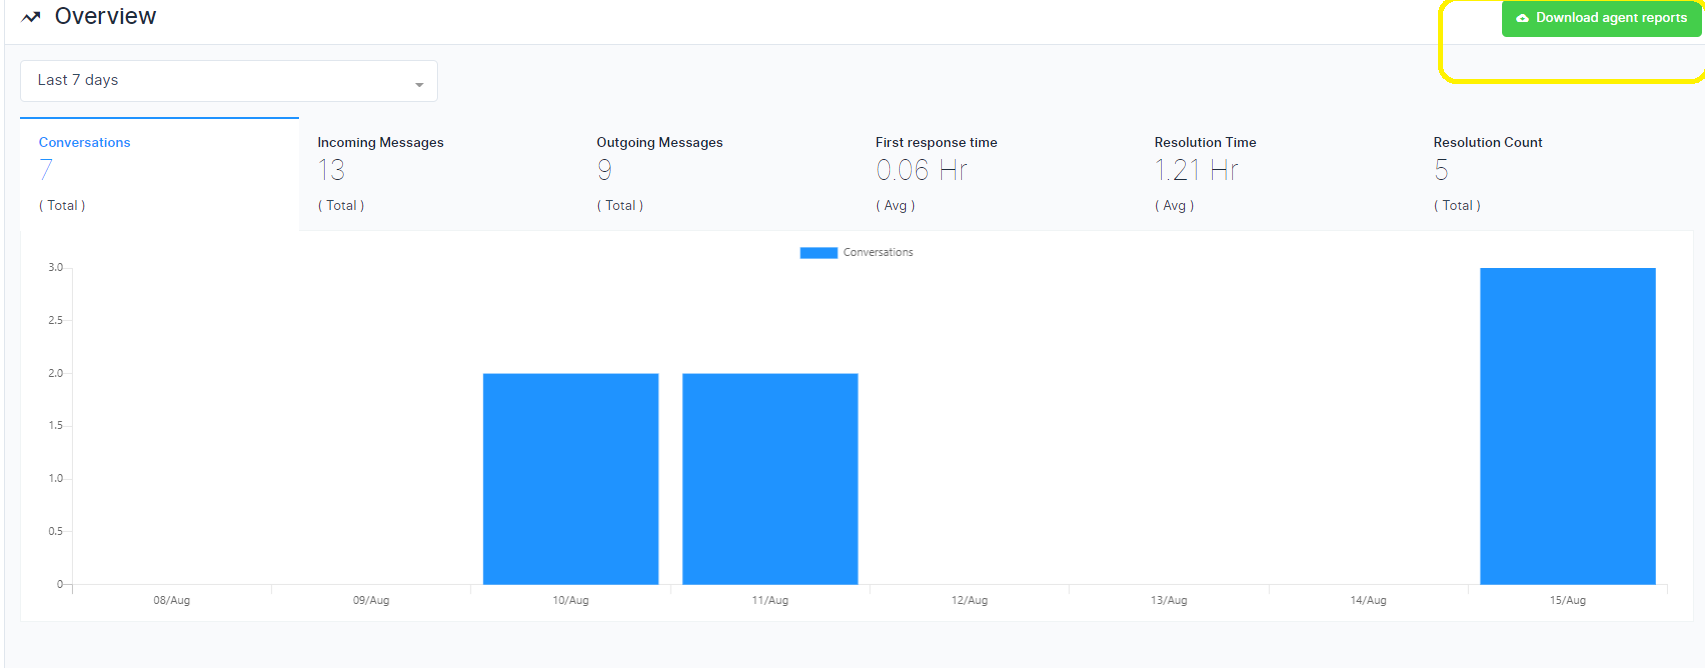
Conversations
Click on Conversations tab in Reports. The graph will show the conversation happened on the selected days. On pointing the mouse to a particular graph of the day, the details of the conversations happened on that day can be found out. An example is given below. On Aug 11, 2 conversations occurred.
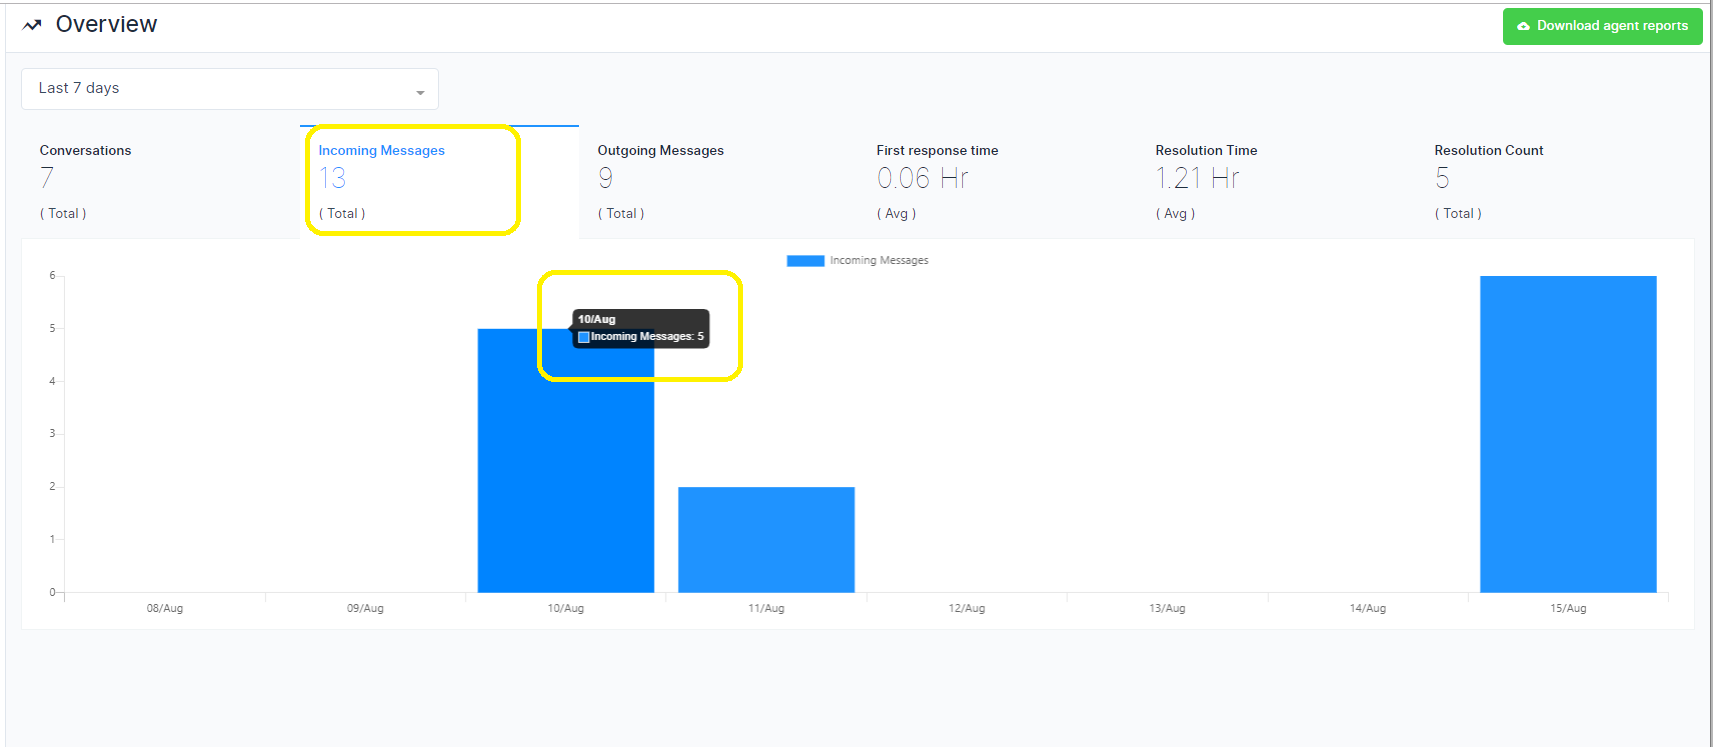
Incoming Messages
Click on Incoming Messages tab in Reports. The graph will show the number of incoming messages happened on the selected days. On pointing the mouse to a particular graph of the day, the details of the number of incoming messages happened on that day can be found out. An example is given below. On Aug 10, 5 incoming messages occurred.
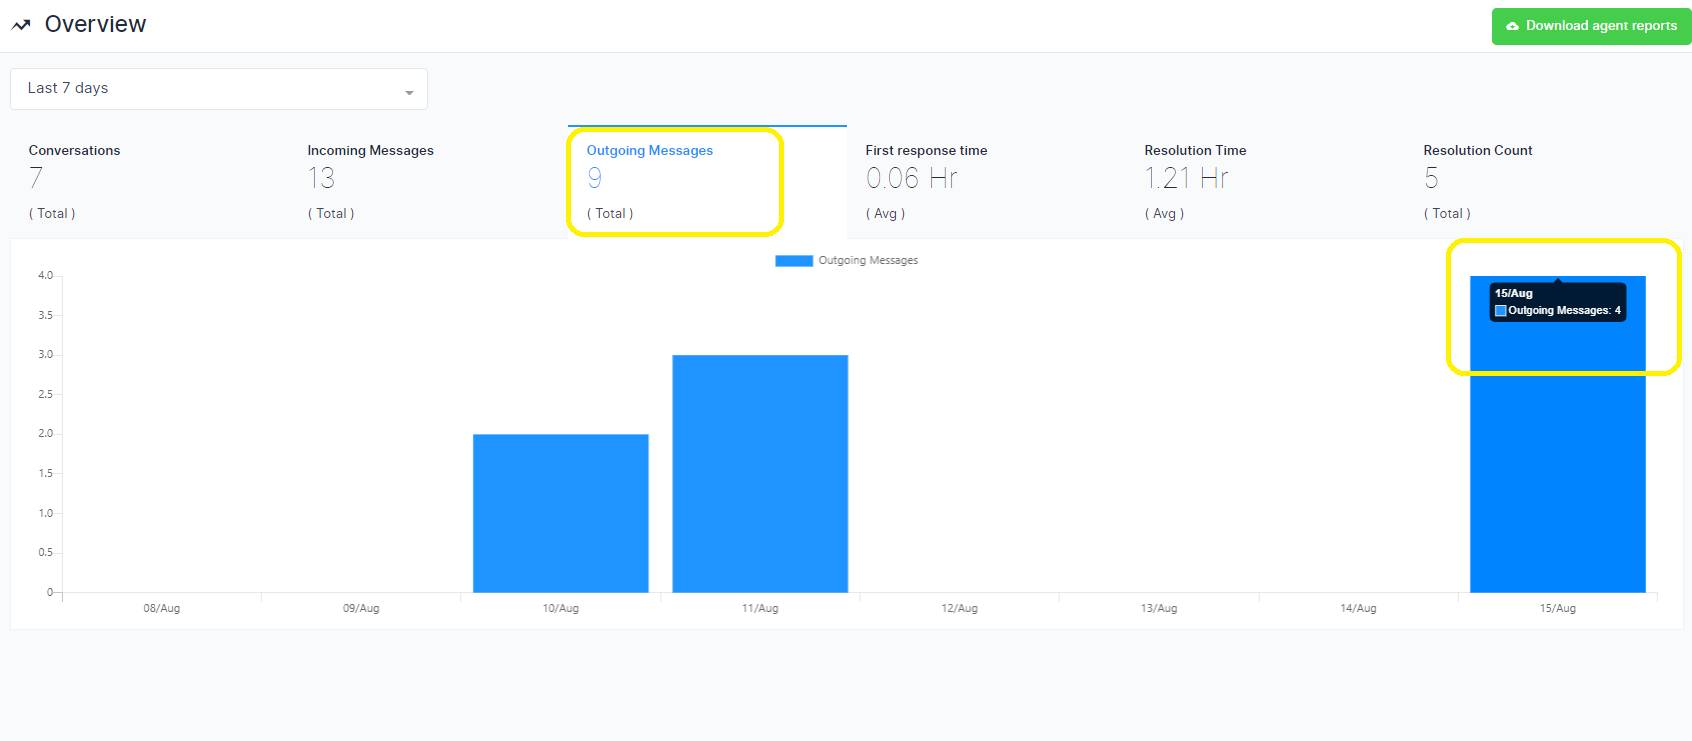
Outgoing Messages
Click on Outgoing Messages tab in Reports. The graph will show the number of outgoing messages happened on the selected days. On pointing the mouse to a particular graph of the day, the details of the number of outgoing messages happened on that day can be found out. An example is given below. On Aug 15, 4 outgoing messages occurred.
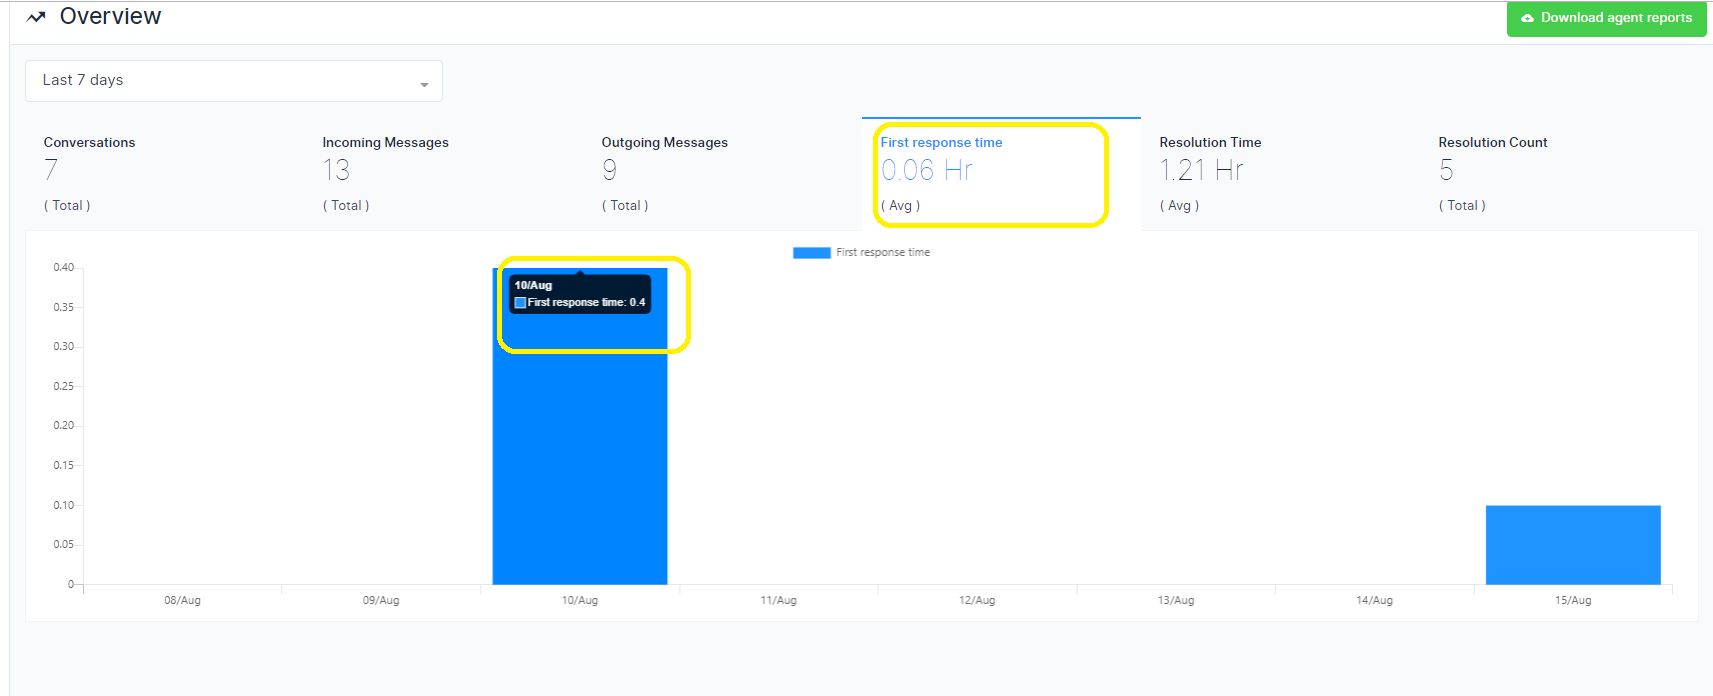
First Response Time
Click on First Response Time tab in Reports. The graph will show the average number of hours taken to give first response to a conversation with a customer. On pointing the mouse to a particular graph of the day, the average number of hours taken for first response for that particular day can be found out. For example, on Aug 10, average First response time was 0.4 hours.
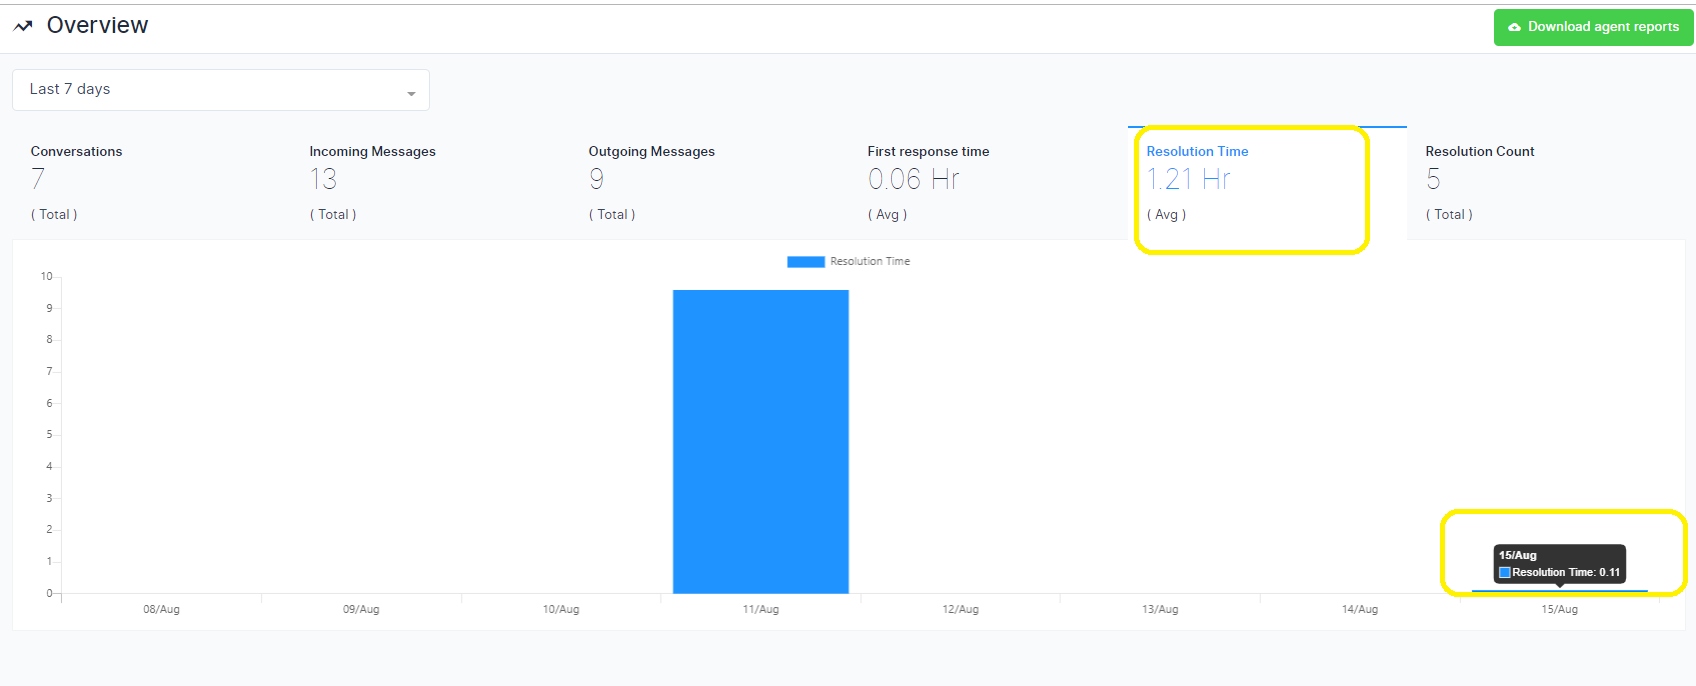
Resolution Time
Click on Resolution Time tab in Reports. The graph will show the average number of hours taken to resolve a particular conversation with a customer. On pointing the mouse to a particular graph of the day, the average number of hours taken for resolving conversations for that particular day can be found out. For example, on Aug 15, average First response time was 0.11 hours.
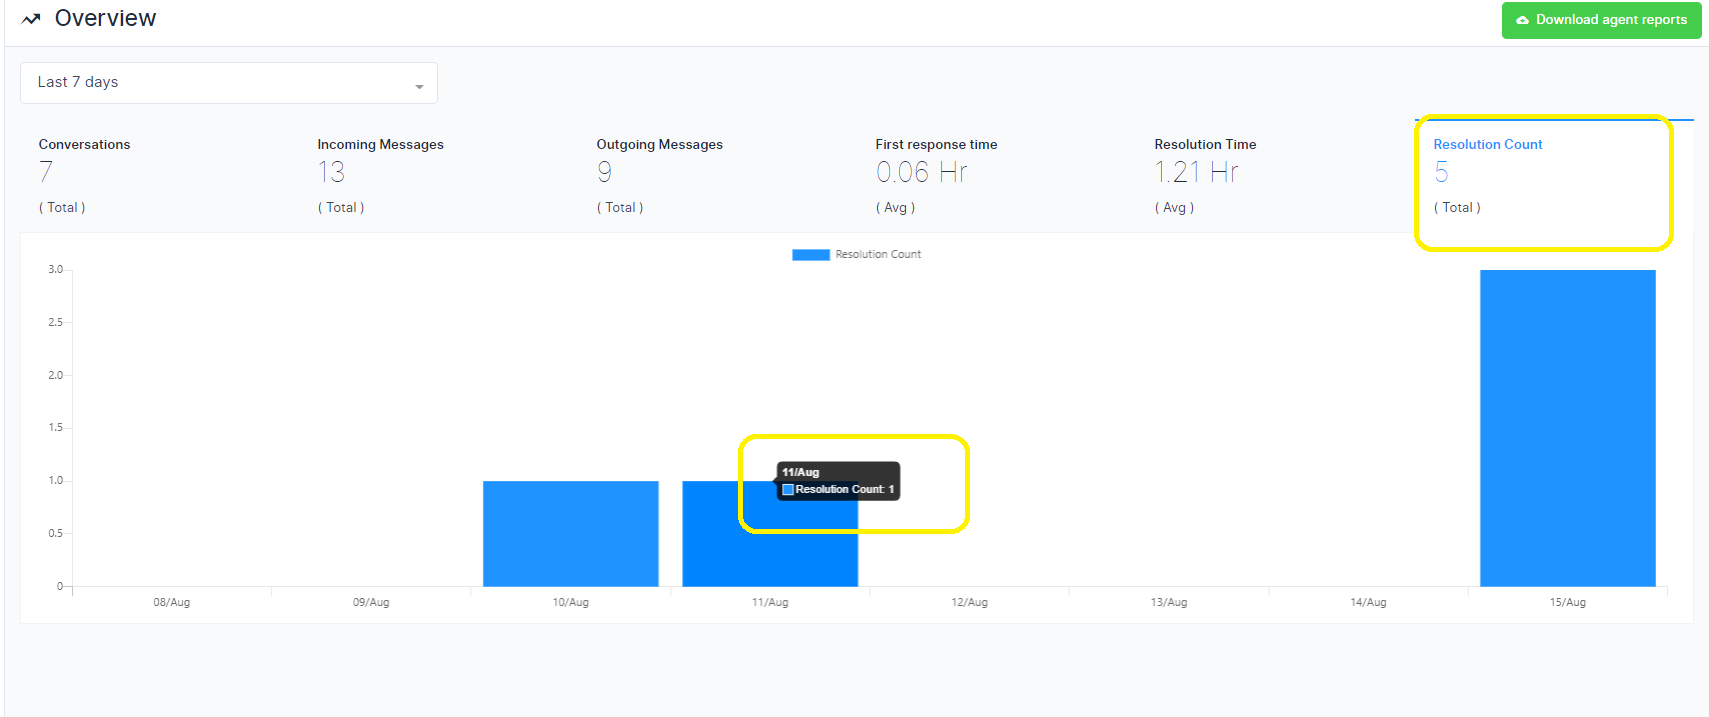
Resolution Count
Click on Resolution count tab in Reports. The graph will show the number of conversations resolved on the selected days. On pointing the mouse to a particular graph of the day, the details of the number of conversations resolved on that day can be found out. An example is given below. On Aug 11, 1 conversation was resolved.
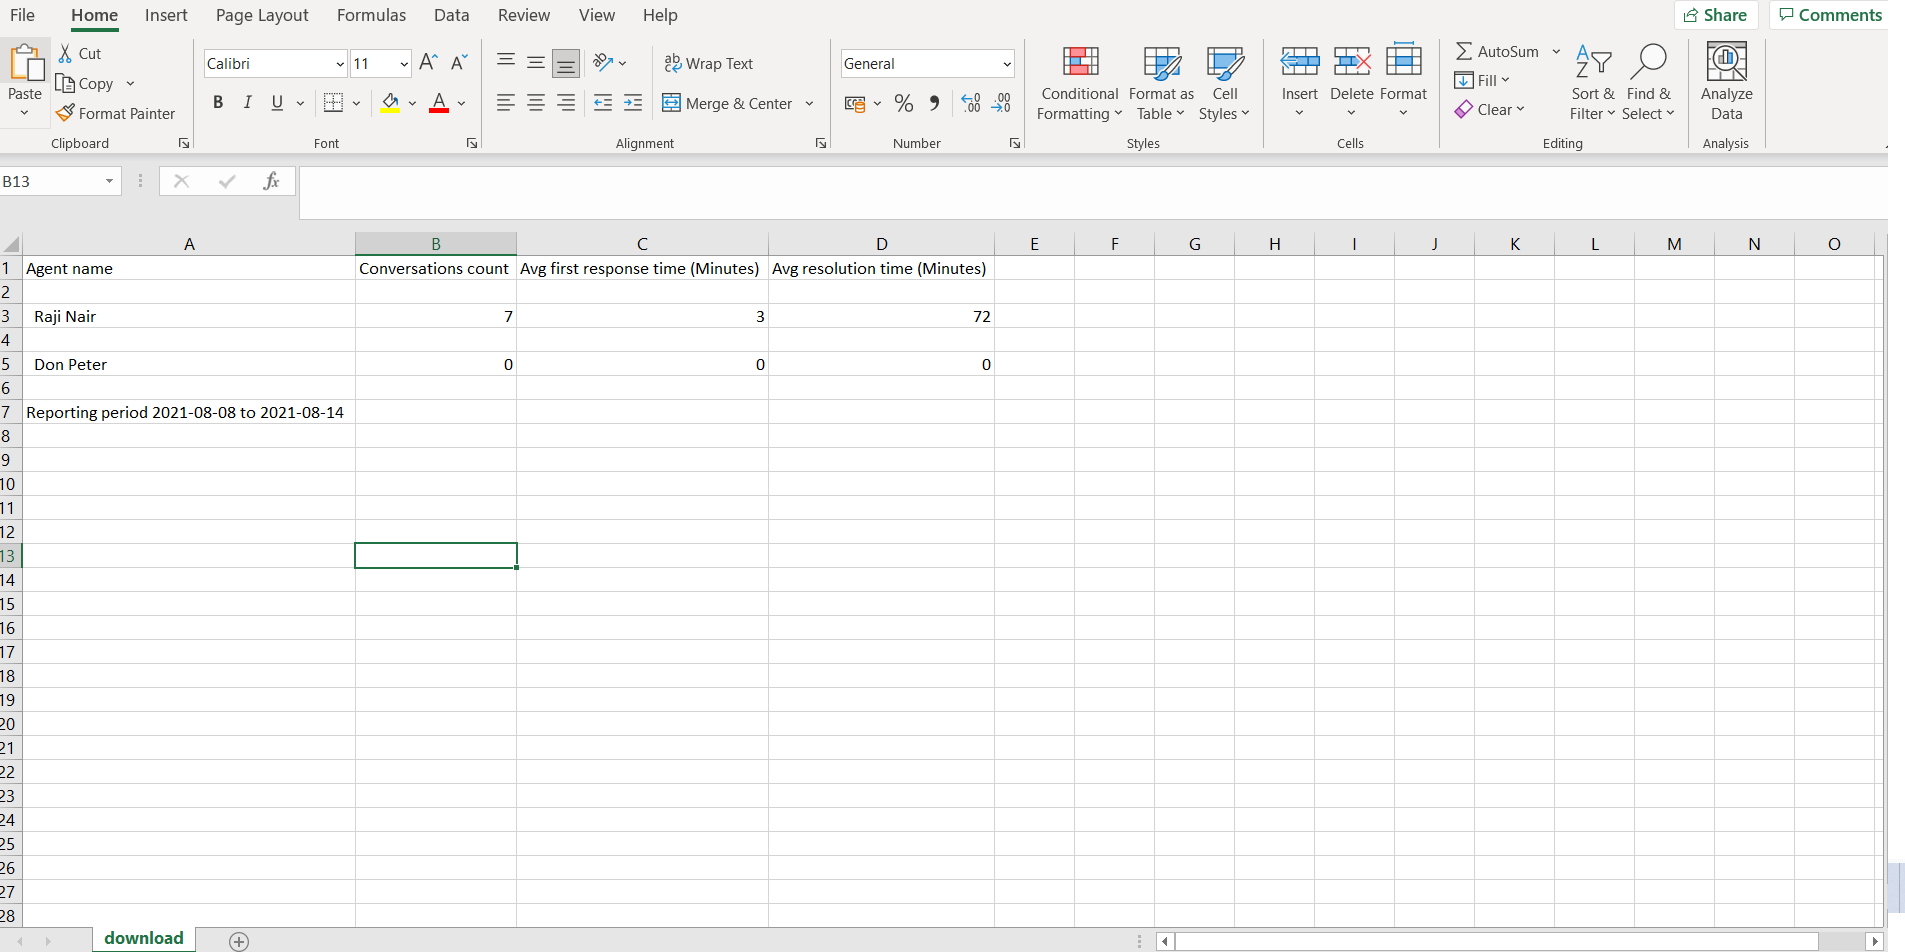
Download agent Reports
Details of performance of Agents can be done by clicking the Download agent Reports button given on the right hand top side of the page. The report will be downloaded in csv format. Example given below.
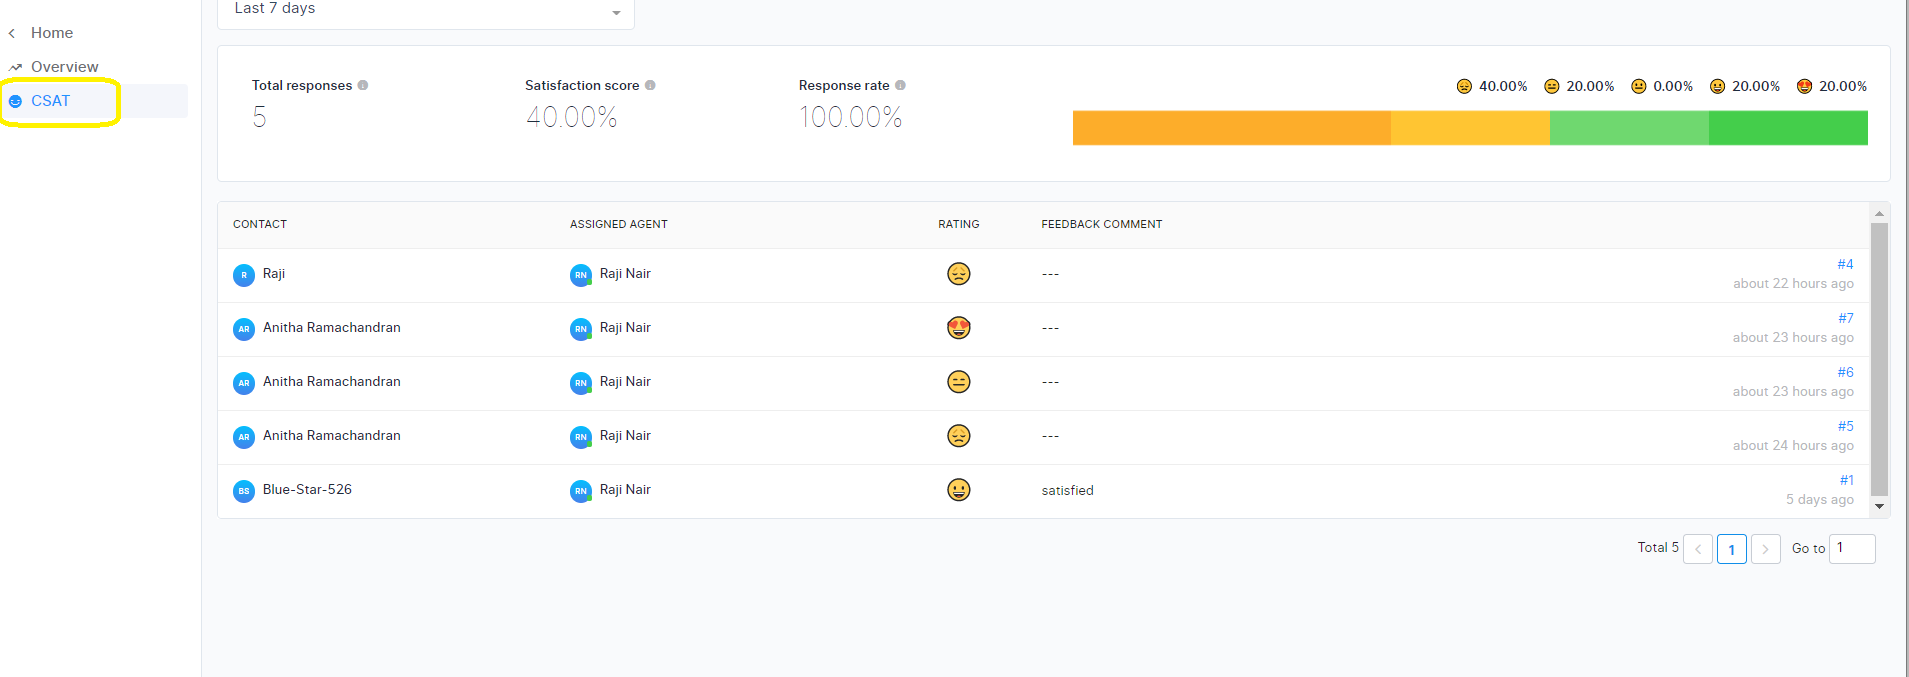
CSAT
All the Customer Satisfaction surveys which have been collected from the customers during the end of the conversation can be seen here.
Click on 'Reports' on Chatlake Dashboard Home Screen.
Next, click on 'CSAT'. The screen will show the details of the Customer Surveys.
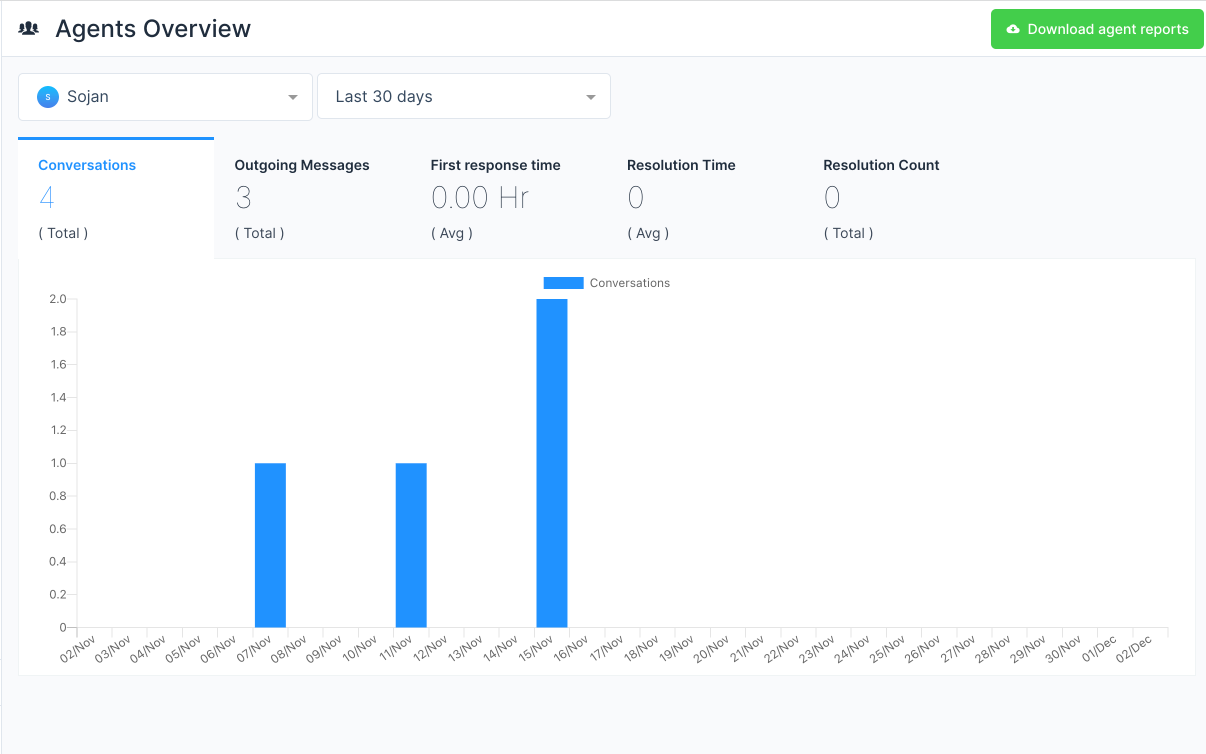
Agent reports
You can also filter and download reports by agent. Click on the reports in the sidebar and select "Agents".
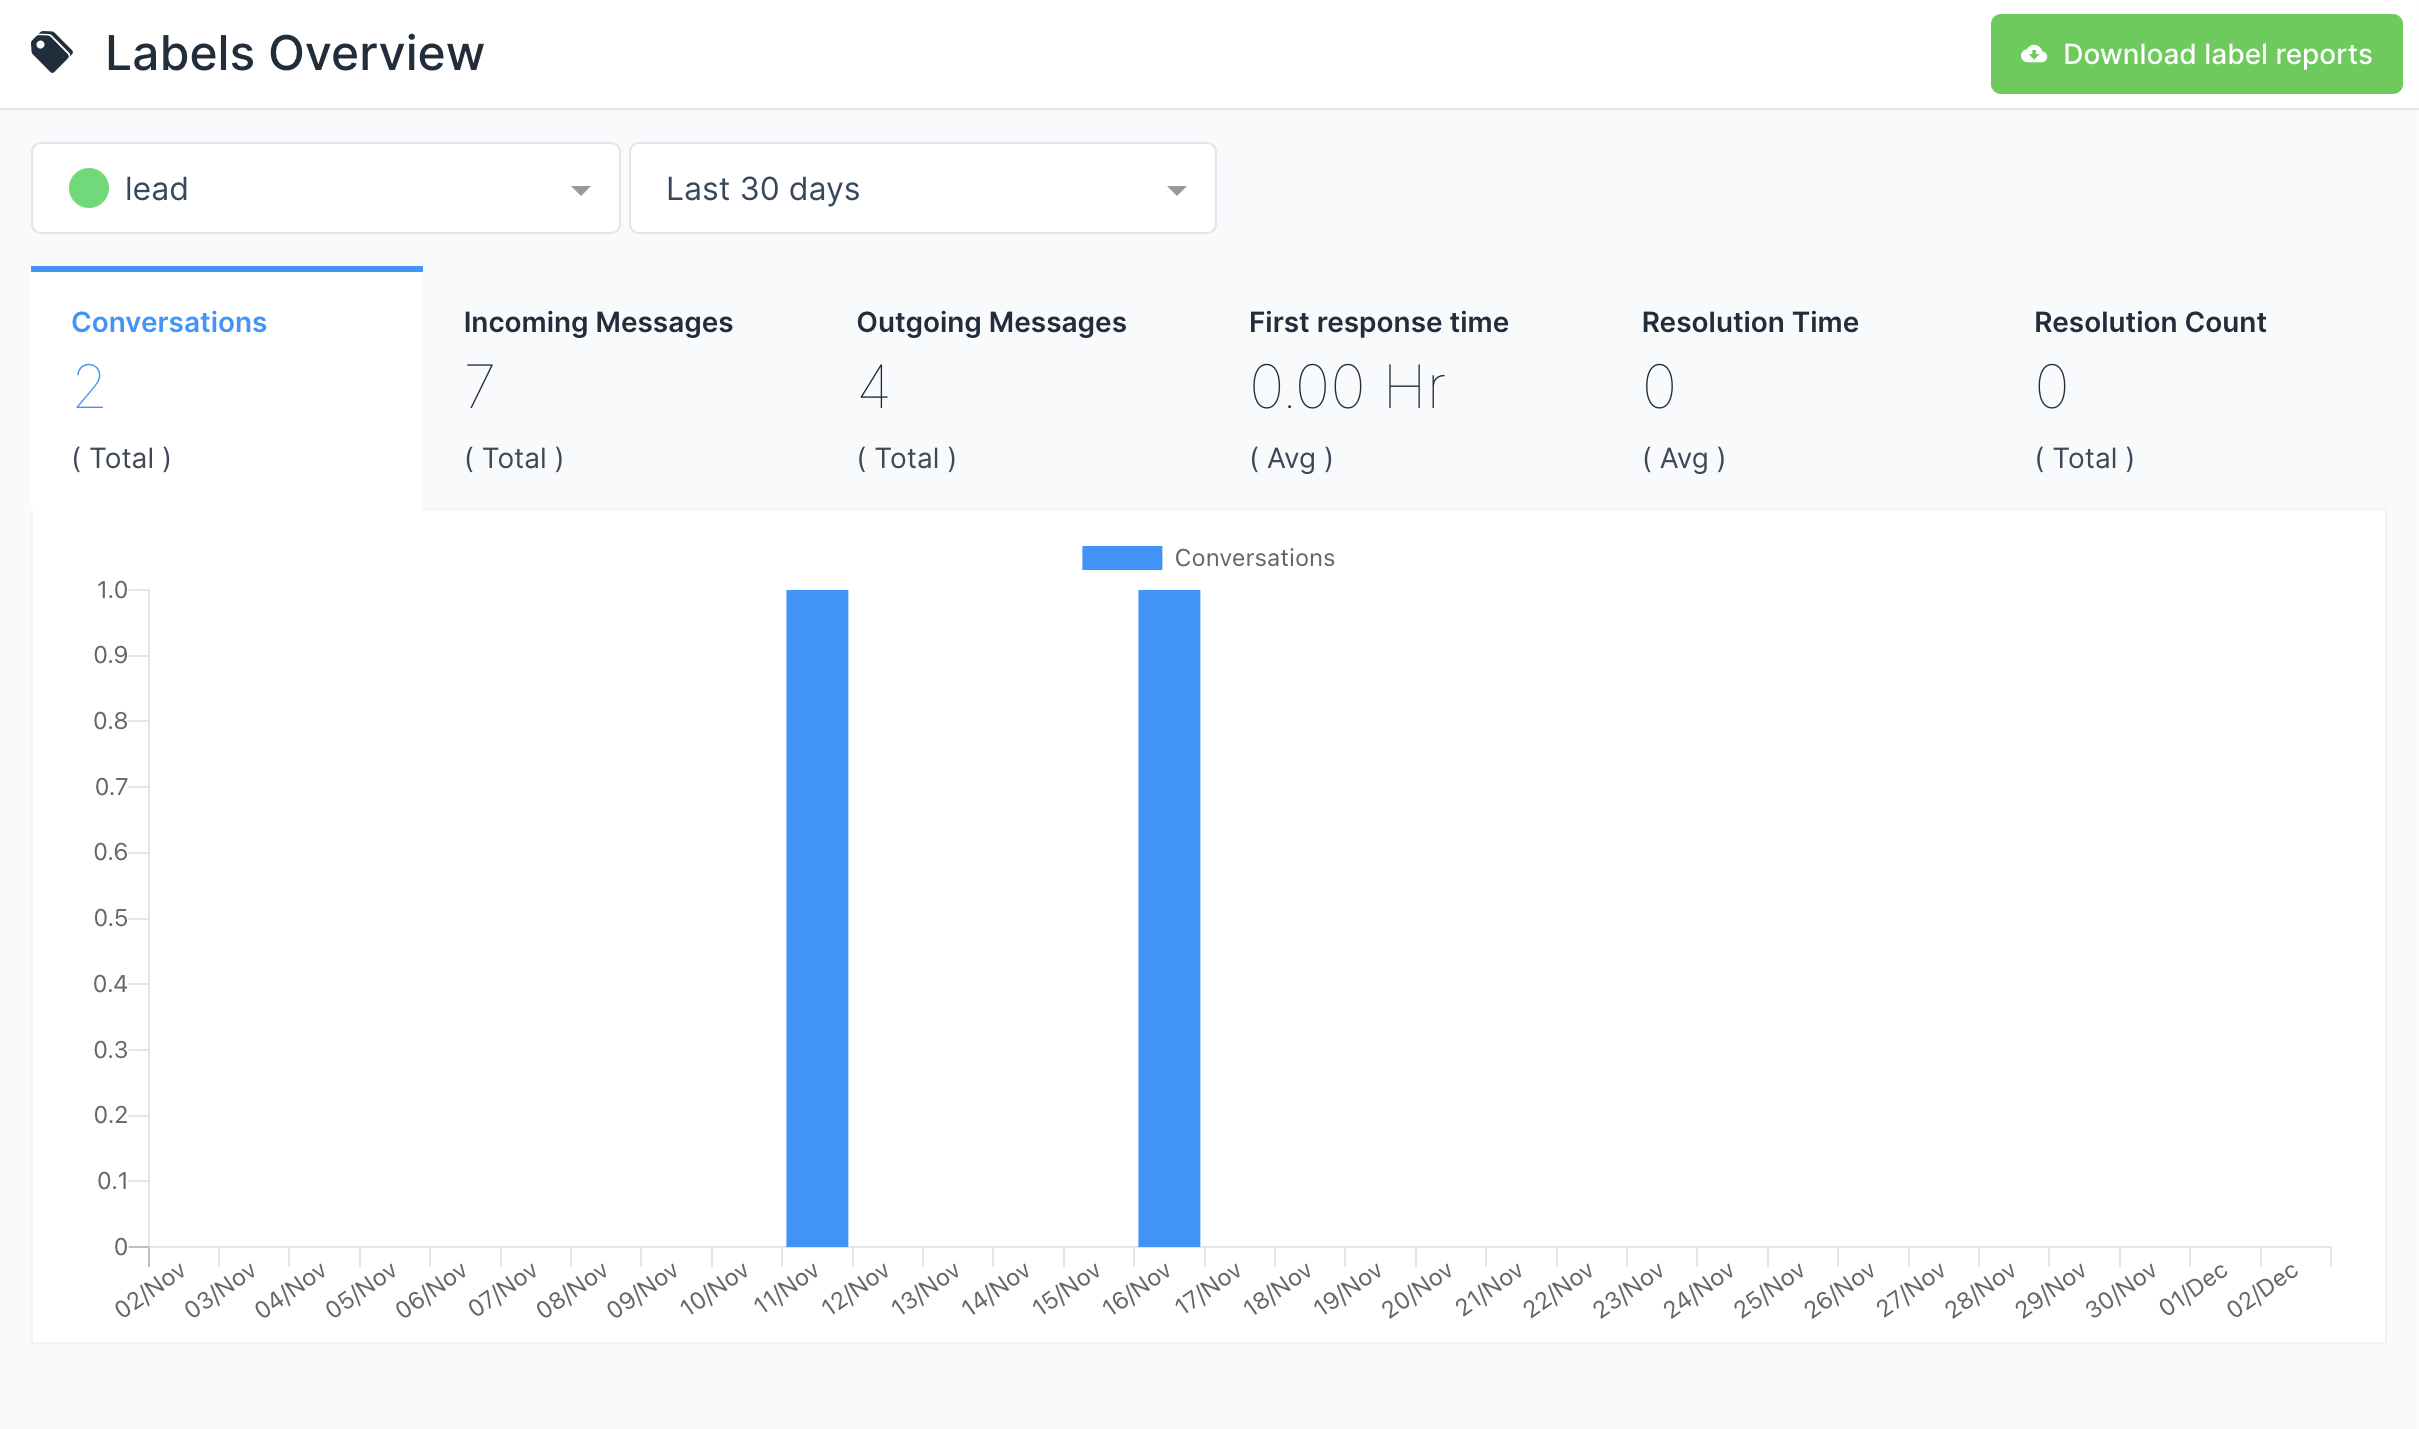
Label reports
You can also filter and download reports by labels. Click on the reports in the sidebar and select "Labels".
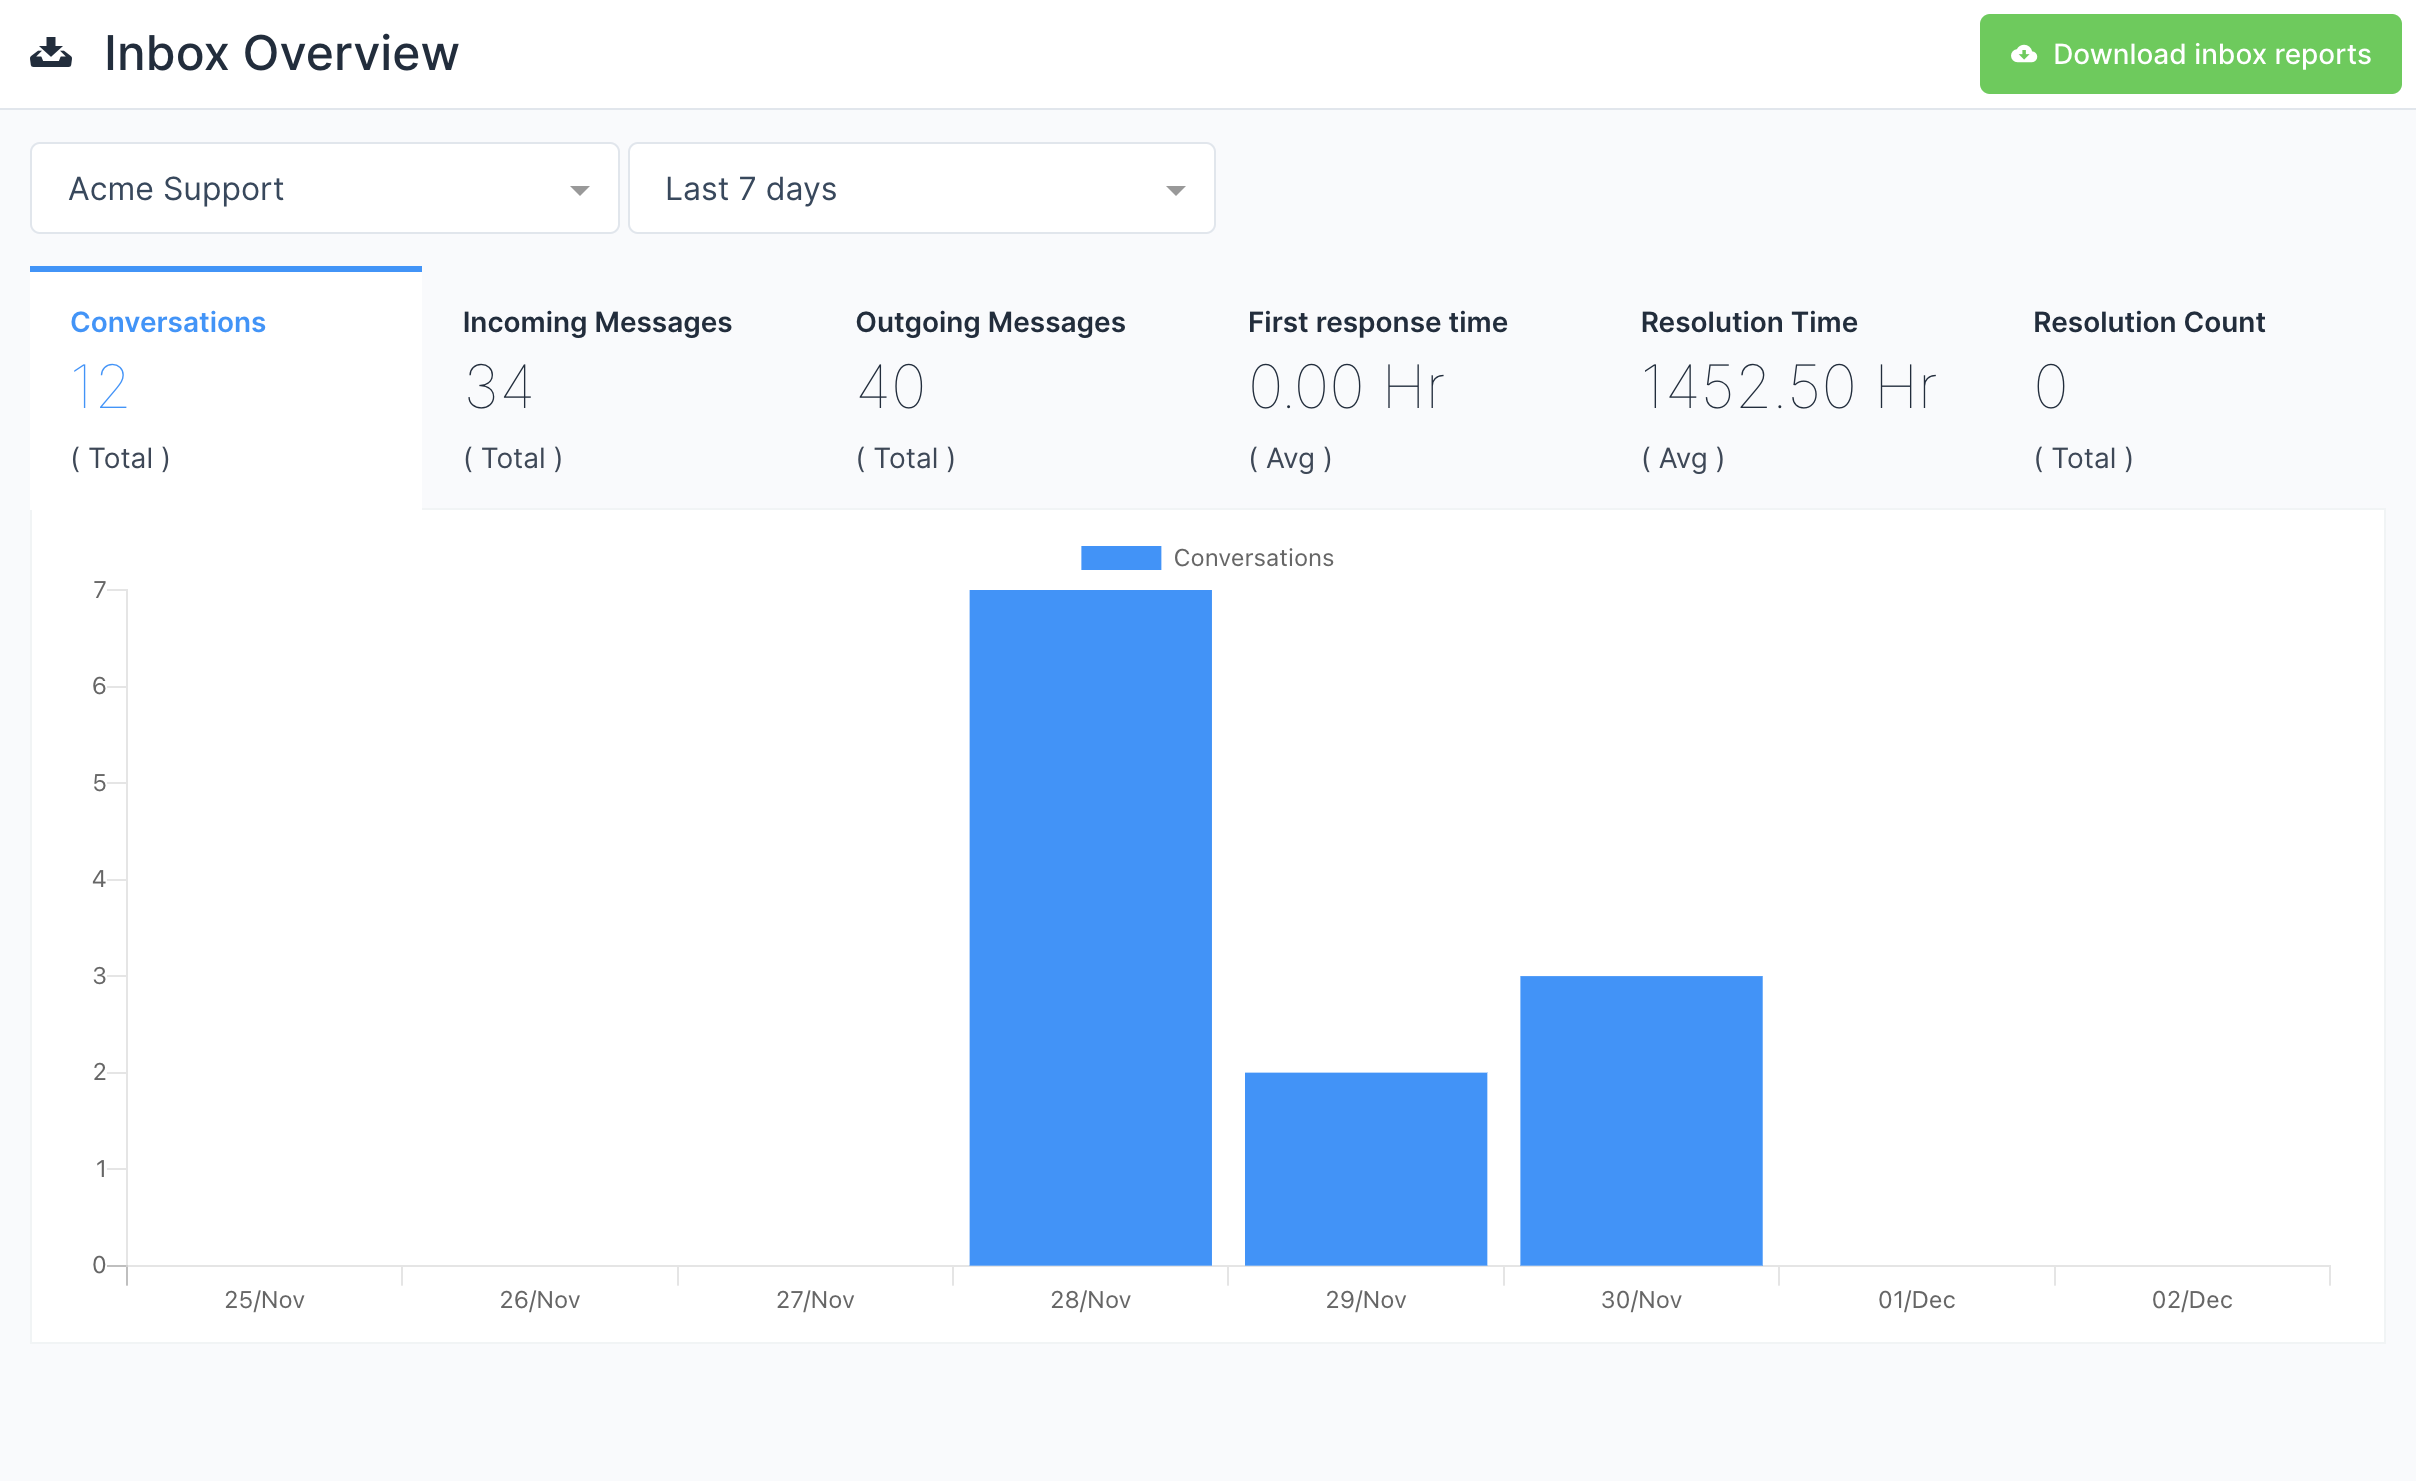
Inbox reports
You can also filter and download reports by inboxes. Click on the reports in the sidebar and select "Inbox".
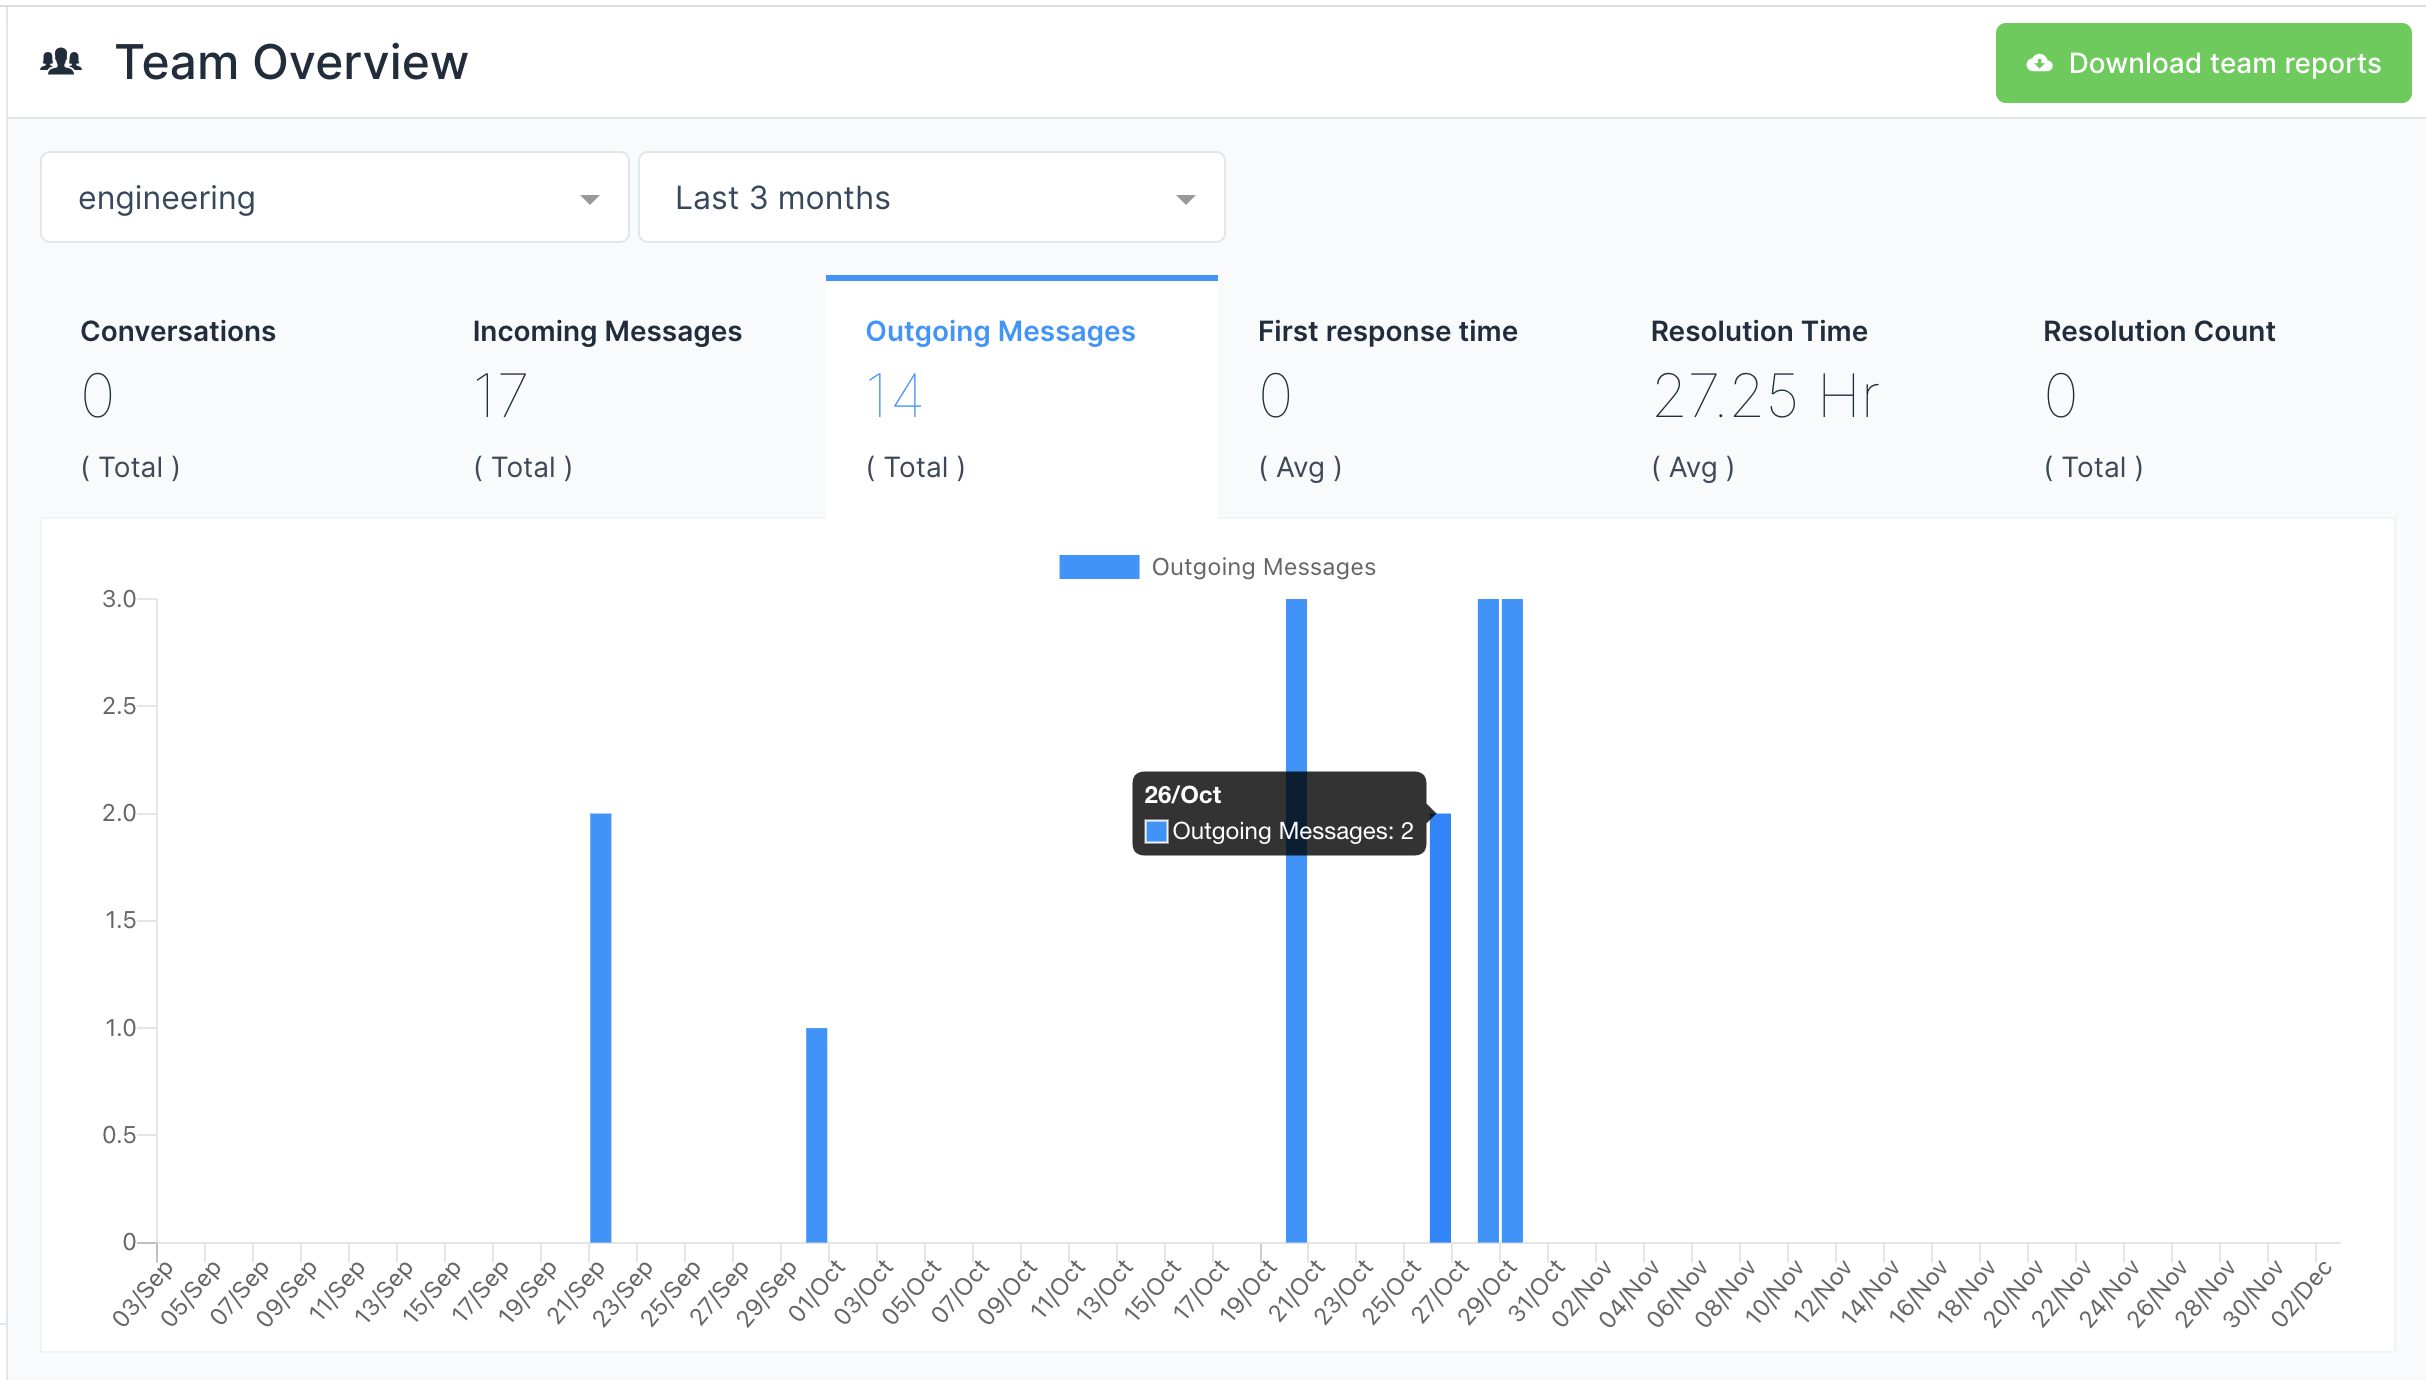
Team reports
You can also filter and download reports by teams. Click on the reports in the sidebar and select "Team".